Is your website using up too much traffic? Or is it having less traffic than usual?
cPanel's AWStats option provides the answer to these questions by analysing website traffic statistics.
Step 1
If you're on our shared hosting packages, log into cPanel under the "Metrics" section and you will find the "AWStats" option.

Step 2
You will find a list of your domains, it will also be listed with SSL in brackets. This represents statistics calculated for HTTPS access.

Step 3
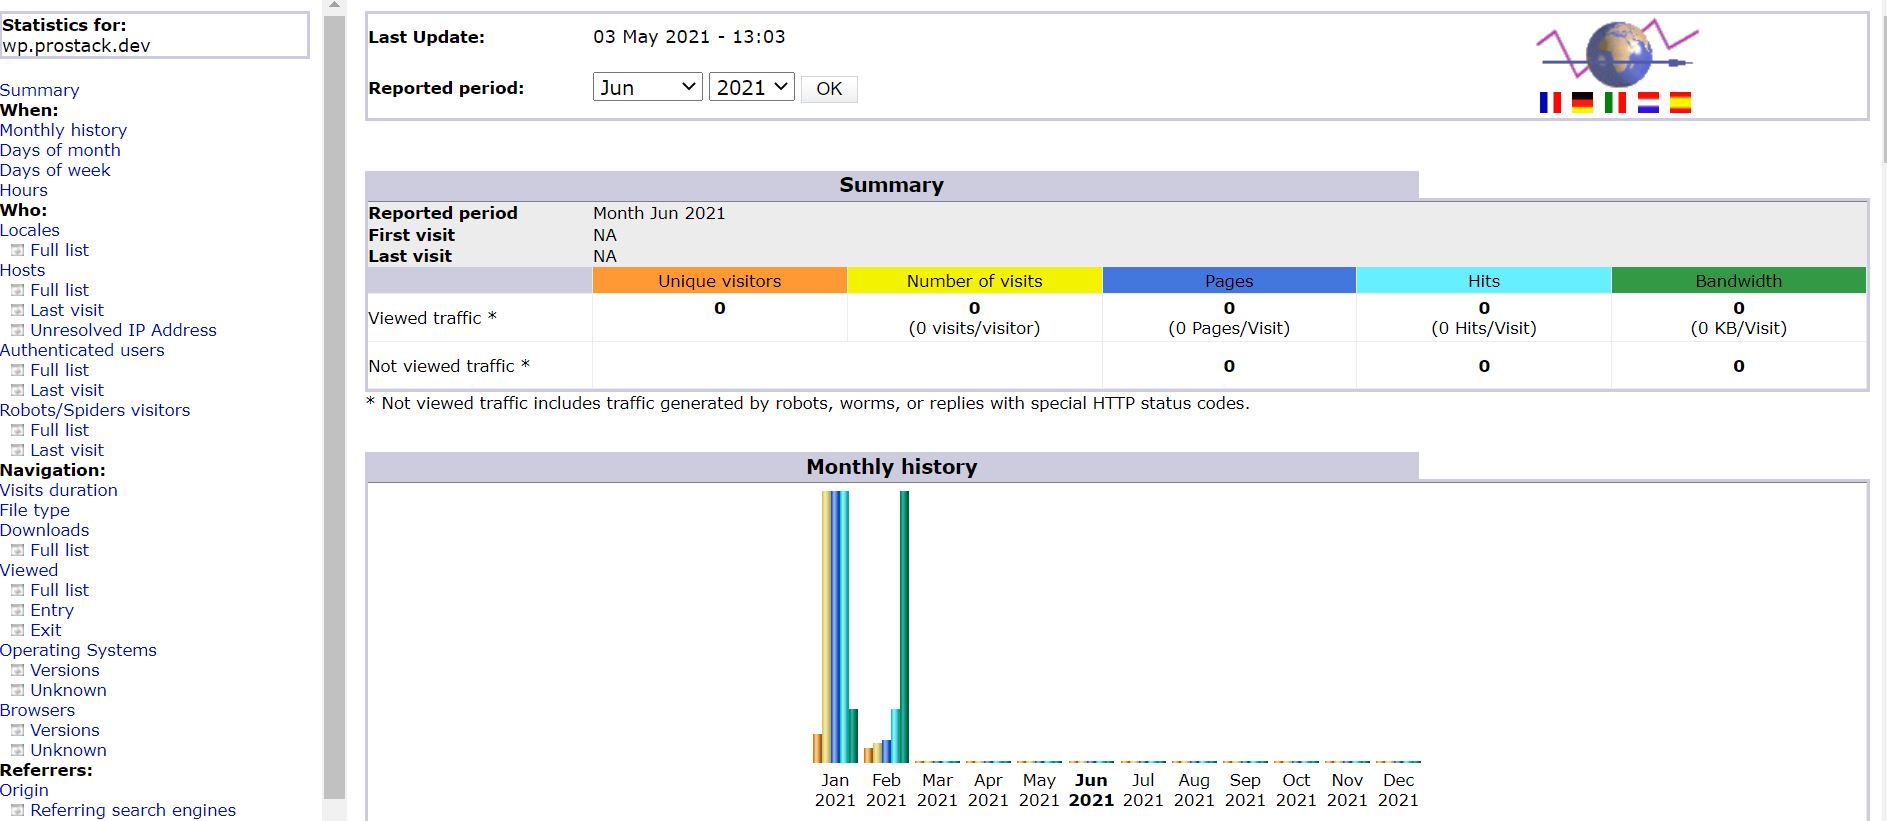
Click on "View" and you will be redirected to the Awstats interface that displays a summary of the website's visitor data.

Step 4
This summary section displays data in "Viewed traffic" and "Not viewed traffic" and they include the following:
- Unique Visitor - A unique visitor is a person or computer that has made at least 1 hit on 1 page of your website during the current period shown by the report.
- The number of visits - Number of visits made by all visitors.
- Pages - The number of pages viewed by visitors. Pages are usually HTML, PHP, or ASP files, not images or other files eg: JS, CSS, etc.
- Hits - Any files requested from the server.
- Bandwidth - This number includes only traffic for web-only - or mail only, or FTP only depending on the log type selected.
These statistics are updated on a daily basis and by default, a report for the current month is presented when the interface is accessed.
Step 5
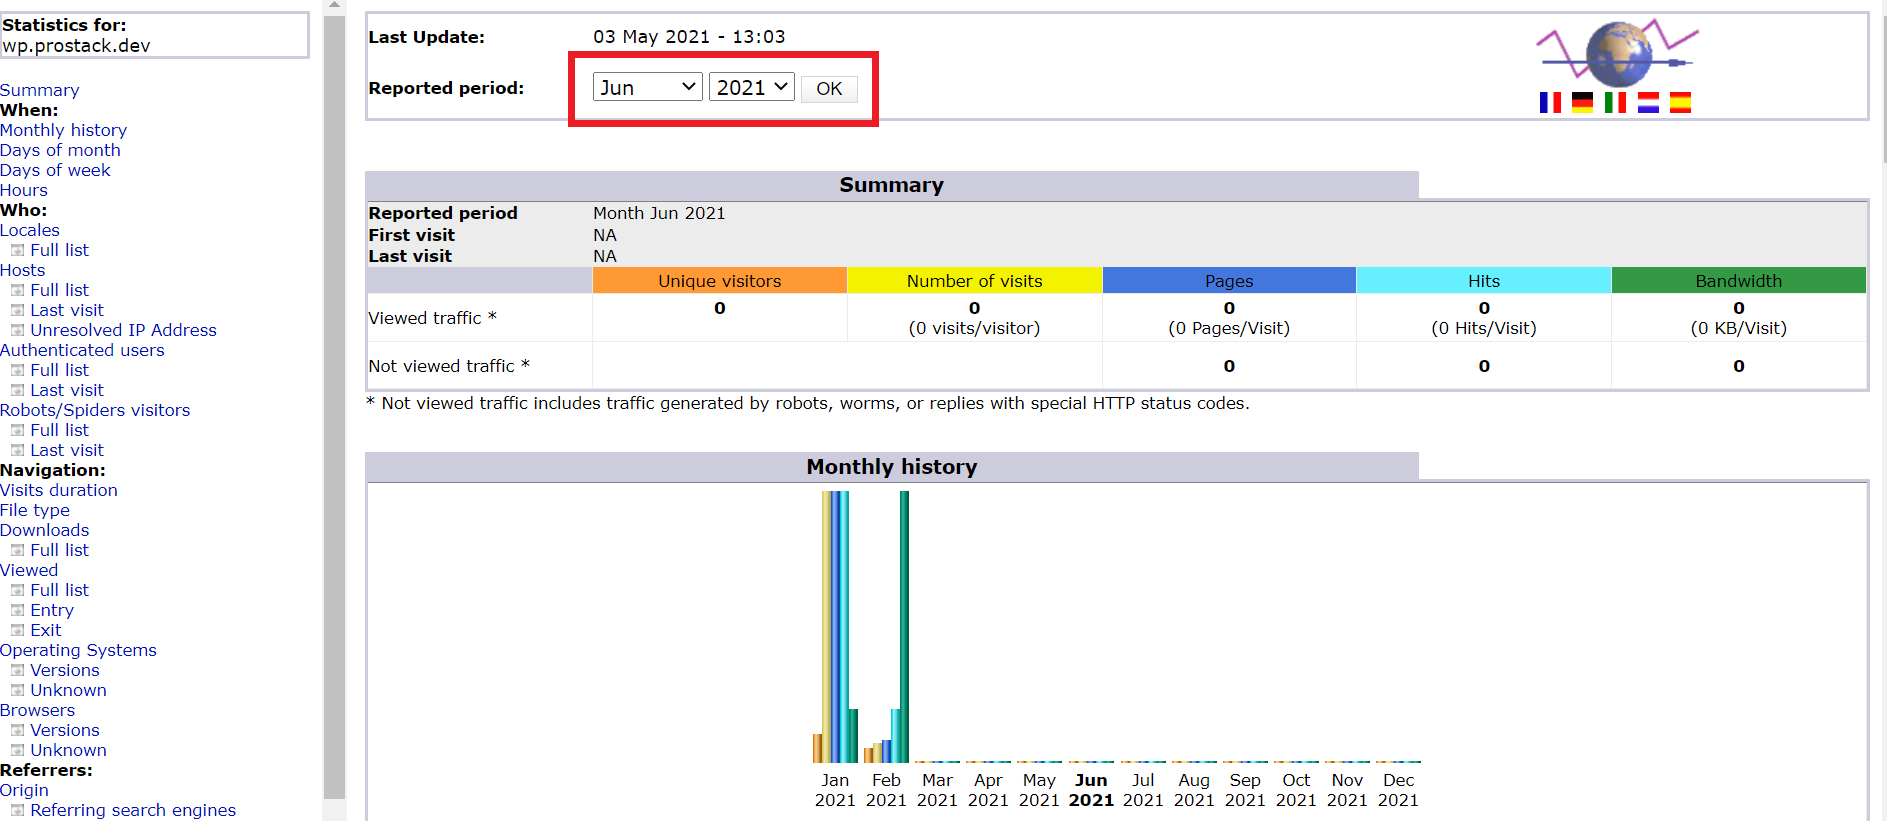
To view data for previous months, click on the drop-down menu shown at the top of the page.

Scrolling down the page you'll find a graphical display of the stats and further information with respect to the site's traffic.
Step 6
Navigate through the left sidebar, this provides an extended report of the summarized fields. Fields that you need to pay more attention to are mentioned below:
- Locales – list of visitor countries ranked by page visits with hits and bandwidth metrics.
- Hosts – report showing details of visitor IP addresses with date stamps, page visits, hits and bandwidth.
- Authenticated users – users who have logged into a password protected area of the website.
- Robot/Spiders visitors – a list of web crawling robots that have visited the website.
- Downloads – list of files that have been downloaded from the website.
- Viewed – list of URLs visited by website users.
- Operating Systems – detailed statistics on the operating systems run on the devices that were used to visit your website.
- Browsers – statistics on the web browser applications used to visit the website.
- Referrers – search engines and websites that link to your content.
- Search – list of search phrases and keywords used to identify and link content on your website. This analysis is useful and helps identify what the users are looking for in the website and thereby support SEO (search engine optimization) strategy.
- Errors – list of pages that are currently generating errors when visited. Identifying and resolving these errors promotes a better user experience and will improve your standing with search engines.
- HTTP Status Codes - lists status codes returned when visited and indicate the status of a request.
More information provided by AWStats can be found here.
Customers on reseller, cloud, and dedicated server packages, login to WHM and then access the particular account's cPanel from Home >> Account Information >> List Accounts and then click on the cPanel icon (![]() ) displayed across the account name.
) displayed across the account name.
Once you have access to the account's cPanel interface, please follow the steps mentioned above to display the statistics report from "Awstats".
Need further assistance?
Please do not hesitate to contact our support team if you require further help. Get in touch today!


