![]()
![]()
![]()
Warning: Paper Lantern is now deprecated and will be removed, it is recommended you make Jupiter the default theme for all cPanel Accounts.
The cPanel interface is the hub of your cPanel user account to access important information and updates and Glass is the default style for new users.
cPanel interface categories
The cPanel interface consists of the following:
- Navigation bar
- The Welcome Panel
- General Information
- Features
- Statistics
Navigation bar
The navigation bar is displayed in every cPanel interface. This provides the account information, the search bar, and controls to change settings and log out.
- Site logo - navigates to the home page.
- Searchbar - quickly search sections you wish to access.
- Account information (icon) - manage preferences, password changes, language options, and update contact information.
- Notifications - if you have a blue dot on-screen you have a message, warning, or error on your panel account.
![]()
The Welcome Panel
This section will only display for new user accounts. This section will provide common features that new users often access.

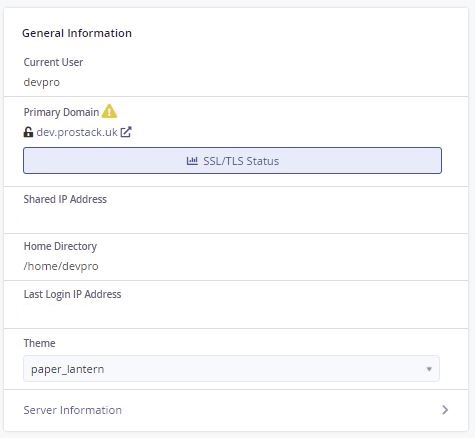
General Information
- Current User - Name of current cPanel account.
- Primary Domain - The primary or main domain name.
- Shared IP Address or Dedicated IP addresses - current accounts IP address (A shared IP means multiple websites within one server use a single IP address + a dedicated IP address means that the website owns its own IP address).
- Home Directory - The absolute path to the accounts
/homedirectory on the server. - Last Login IP Address - The IP address of the user that most recently logged in.
- Theme - The current cPanel theme.
- Server Information - Here you locate the server information interface, which provides additional information about the account and server.
Features
The cPanel interface lists the available features in groups for different types of functionality.
Here you can click and drag the feature groups to customise the preference order.

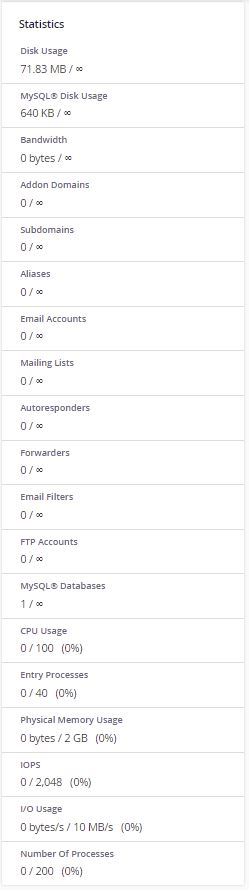
Statistics
The Statistics section displays important usage statistics for your cPanel account.
Here you can locate Warning signs for the following:
- Your server cannot retrieve information about the item's usage or quota.
- Your account uses 80% or more of an item's quota.
Here you can easily locate the following information:
- Disk Usage
- MySQL Disk Usage
- Bandwidth
- Addon Domains
- Subdomains
- Aliases
- Email Acounts
- Mailing Lists
- Autoresponders
- Forwarders
- Email FIters
- FTP Accounts
- MySQL Databases
- CPU Usage
- Entry Processes
- Physical Memory Usage
- IOPS
- I/O Usage
- Number of Processes
Need further assistance?
If you require further assistance please contact the ProStack team and we can help get this resolved for you! Get in touch today!

![]()
![]()
![]()
