
Jimmy Crutchfield
4 April 2021
At Prostack we’re constantly evolving the way we observe and monitor our platform.
Internally, this is driven by our Prometheus monitoring system, which ingests real-time data on the health of our customer’s websites, servers and network, and generates alerts if something goes awry.
Whilst we have excellent visibility of how our services perform internally, we wanted to improve how we monitor our services externally. Beyond the edge of our network the internet is a complex and often unreliable place, and occasionally things go wrong. When this happens, we want to know about it. Sometimes customers would contact us to say “My site is down” when there appeared to be no obvious problem with our systems; the issues they were experiencing were caused by their ISP or an intermediate network along the way to us.
As part of this effort we set out to answer the question: “How do customers on X ISP reach us?”. In this case X could be any ISP, but we started with the most common originators of traffic on our network- BT, Virgin Media, and Sky Broadband. We wanted to find out as much as we could about the network path between these ISPs and our systems, and graph that data so we could see if anything changed.
Enter: RIPE Atlas
RIPE Atlas is a “dynamic, global network of thousands of probes that have been measuring Internet connectivity and reachability in near real time since 2010″. Anyone can directly access the data collected by RIPE Atlas, as well as Internet maps, graphs, tools and analyses based on the aggregated results, at https://atlas.ripe.net. RIPE Atlas was developed and is operated by the RIPE NCC, along with the help of thousands of volunteers.
We can use RIPE Atlas probes, located in the ISPs mentioned above, to run “measurements” – connectivity tests that give us detailed information about reaching our network. These measurements run continually, so we wanted to graph the data so that we can see if anything changed.
Atlas Exporter
As we mentioned at the start of this post, we use Prometheus as our core monitoring platform. Prometheus is a time-series database which ingests data from various systems using “exporters” – small pieces of software that gather metrics and make them available for “scraping” – i.e. ingestion. We’re using Daniel Czerwonk’s excellent Atlas Exporter– a prometheus exporter that lets us take RIPE Atlas data and pull it into our monitoring system.
Having this data in Prometheus means we can do two key things: graph the data- using Grafana- and generate alerts from it.
Putting it all together
We set up Atlas measurements to monitor network latency from three UK ISPs:
- BT
- Sky
- Virgin Media
To two of our “gateways” – entry points into each datacentre we operate from in the UK.
These measurements run every 5 minutes and are ingested into Prometheus by the Atlas exporter. We then graph them using Prometheus:
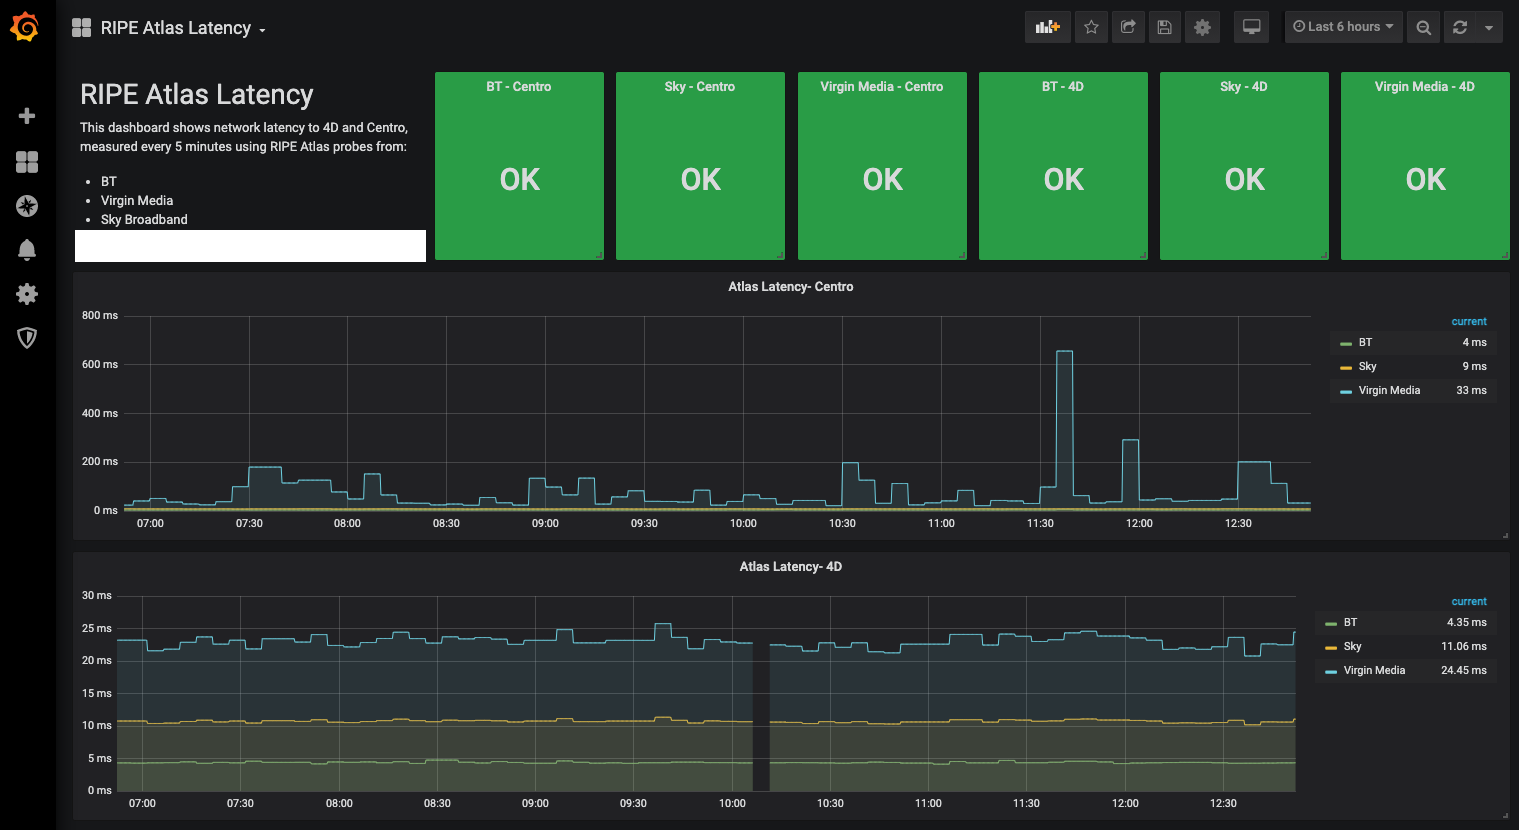
This lets us see at a glance if there are any major changes, latency spikes, or other issues that may be occurring outside of our own network- for example a routing problem or outage for certain customers. We also use Atlas Exporter to run continuous traceroutes, and see if anything changes with the number of network hops it takes to reach us.
Expanding our view
Right now we’re only monitoring these three ISPs (because they are the “eyeball” – customer- networks that generate the most inbound traffic for us). We’re also not generating any alerts from the data whilst we’re testing the system.
We have some further work planned to make better use of the Atlas data, by expanding our probe coverage to more ISPs.
Hopefully this post has given you some insight into how we solve some of the more challenging problems with monitoring the health of our network from an external perspective. If you’re interested in learning more, or want to explore our managed hosting offerings, get in touch, or use the links below to find out about our services.
![Are you Black Friday ready? [E-commerce checklist]](https://prostack.uk/wp-content/uploads/2026/02/Prostack-BlogImage-Oct25-BlackFriday-700x425.png)